Exclusive Resources / DCF Valuation Model
The DCF Valuation Model
Estimate the fair value of any individual stock from public data. Enter a few numbers from the company's filings, set bear, base and bull assumptions, and see what a share may be worth.
Get the free DCF model
Enter your email and the download unlocks right here, instantly. No password, no credit card. You will also get new LTLM posts and tools. Unsubscribe anytime.
100% freeTakes 5 secondsExcel and Google Sheets
Your DCF model is ready
You are in. Welcome to Learn to Love Money.
Download the spreadsheet, then follow the steps below. Setting it up for a stock takes about 20 minutes.
Download the modelLTLM-DCF-Valuation-Model.xlsx · 33 KB · Free
Using Google Sheets? Here is how →What it is
A discounted cash flow (DCF) model values a company by estimating the cash it will produce in the future and converting that back into today's dollars. It is how many professional investors ask, "What is this business worth, and is the price fair?" This spreadsheet does all the math. You supply the data and your honest assumptions.
Start Here
What the model does and the six steps to use it, with a color key.
Find Your Data
A guide to every input: exactly where to find it in the company's filings.
Inputs
One page for everything you type: market data, last year's results, three scenarios and the discount rate, with a built-in WACC helper.
Results
Fair value per share, how it compares with today's price, a buy-below price with your margin of safety, and model checks.
DCF Model
A 10-year projection for each of the bear, base and bull cases, all calculated for you.
Sensitivity
A grid showing how fair value moves when the discount rate and long-term growth change, so you see the range.
A look inside
These screenshots show the model with clearly labeled sample data for a fictional company. Your copy starts with the same samples so you can see how it works, then you replace them with a real company's numbers.
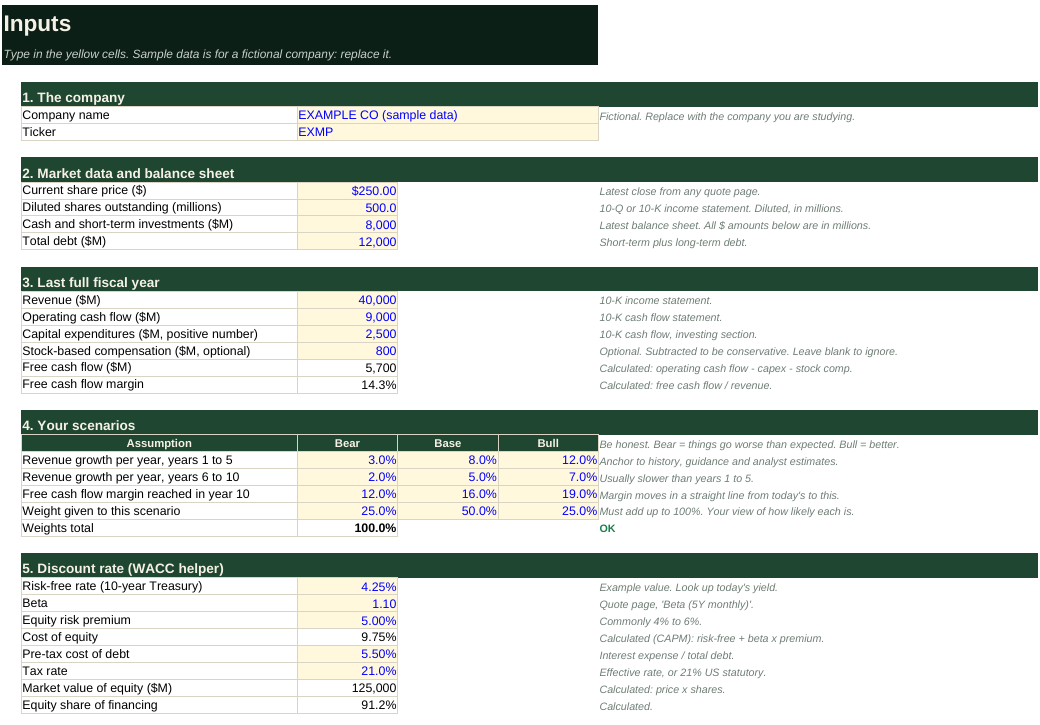
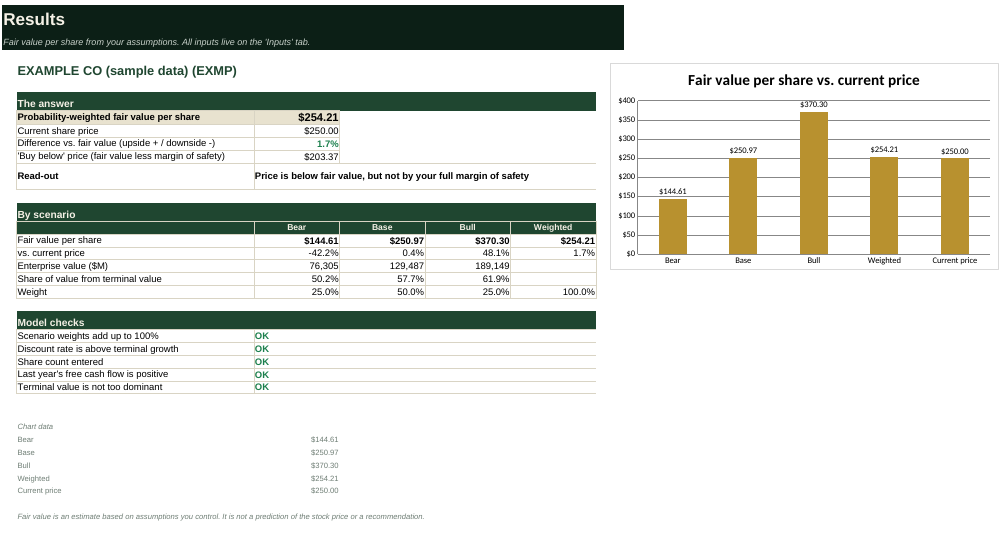
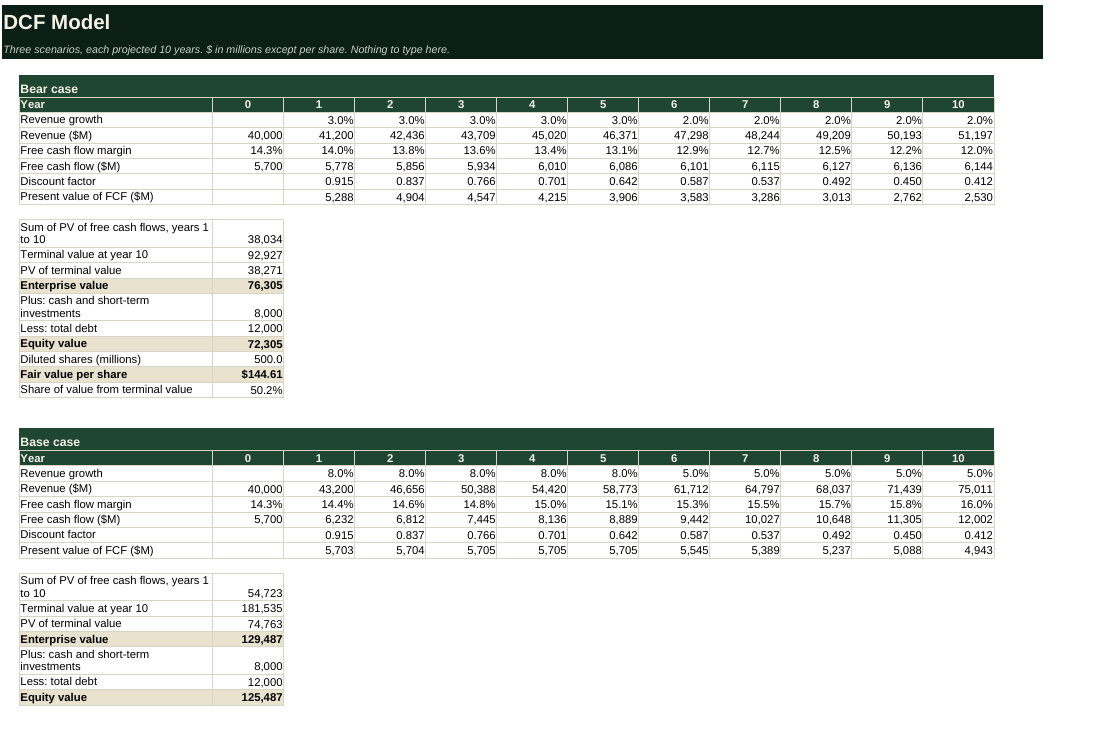
Sample company and numbers are fictional and not a recommendation.
Where to find the data
You do not need a paid terminal. Nearly everything is free in the company's own filings. The spreadsheet has this same guide on its Find Your Data tab.
| What you need | Where to find it | What to look for |
|---|---|---|
| Current share price | Any quote page or your broker's app. | Latest closing price. |
| Diluted shares outstanding | Latest 10-Q or 10-K, income statement. | 'Weighted-average shares outstanding - diluted'. Enter in millions. |
| Cash and short-term investments | Latest 10-Q balance sheet. | 'Cash and cash equivalents' plus 'Short-term investments' or 'Marketable securities'. |
| Total debt | Latest 10-Q balance sheet and debt footnote. | Current portion of long-term debt plus long-term debt. |
| Revenue | 10-K income statement, latest full year. | 'Total revenues' or 'Net sales'. Check whether the units are millions or thousands. |
| Operating cash flow | 10-K cash flow statement. | 'Net cash provided by operating activities'. |
| Capital expenditures | 10-K cash flow statement, investing section. | 'Purchases of property and equipment', plus capitalized software if listed. |
| Stock-based compensation (optional) | 10-K cash flow statement, operating section. | A real cost to shareholders. Subtracting it is more conservative. |
| Growth and margin assumptions | Past: 5 years of 10-K history. Future: earnings release guidance and analyst estimates on free quote pages. | Look at the last 3 to 5 years, then what management and analysts expect. Let growth slow over time. |
| Risk-free rate | treasury.gov or any finance site. | The 10-year US Treasury yield. |
| Beta | Free quote page for the stock. | 'Beta (5Y monthly)'. |
| Equity risk premium | Aswath Damodaran's free monthly estimates (NYU Stern), or a common range. | Usually 4% to 6%. 5% is a common middle. |
| Cost of debt and tax rate | 10-K debt footnote and income tax note. | Interest expense divided by total debt. Effective tax rate, or 21% US statutory. |
Tip: check the units at the top of each statement. Most are in millions, some in thousands. The model expects millions.
How to use it in 6 steps
Plan on about 20 minutes for your first company, and less after that.
- Gather the data. Use the guide above or the Find Your Data tab to collect price, shares, cash, debt, revenue, operating cash flow and capex.
- Type it into Inputs. Delete the sample values and fill the yellow cells. All dollar amounts are in millions.
- Set three scenarios. Choose revenue growth for years 1 to 5 and 6 to 10, plus the free cash flow margin the company reaches in year 10. Bear is worse than expected, Base is your best guess, Bull is better. Give each a weight that adds up to 100%.
- Set the discount rate. Enter the risk-free rate, beta and equity risk premium, and the helper calculates a WACC. Or type your own WACC to override it.
- Read the Results. See fair value per share for each case and a probability-weighted value, compared with the current price. Check that all model checks say OK.
- Stress-test it. On Sensitivity, see how fair value changes with the discount rate and terminal growth. If a small tweak swings the answer a lot, rely on the range, not one number.
The math, in plain English
1. Project cash. Free cash flow = revenue x free cash flow margin, for each of the next 10 years.
2. Discount it. Money later is worth less than money now, so each year's cash is divided by (1 + WACC) ^ year.
3. Add a terminal value. Beyond year 10, the business is valued as FCF x (1 + g) / (WACC - g), then discounted back too.
4. Get to a share price. Enterprise value + cash - debt = equity value. Divide by diluted shares to get fair value per share.
Using Google Sheets
- Download the Excel file, then go to sheets.google.com.
- Choose File → Import → Upload, pick the file, then Replace spreadsheet. Formulas, scenarios and the chart carry over.
Common questions
Is it really free?
Yes. Enter your email, download it and keep it. There is no payment or trial.
Will it tell me if a stock is a buy?
No. It estimates a fair value from the assumptions you enter. It is a tool for thinking, not a recommendation to buy, sell or hold anything.
How accurate is a DCF?
A DCF is only as good as its inputs. Small changes in growth, margins or the discount rate can change the answer a lot, which is why the model uses three scenarios and a sensitivity table.
Does it work for any company?
It works best for companies with positive, reasonably predictable free cash flow. It is a poor fit for banks, insurers, early-stage companies with no cash flow and highly cyclical businesses without adjustments.
What if the free cash flow is negative?
The model still runs because margin moves toward your year-10 target. But for a company burning cash, the answer depends almost entirely on that target margin, so treat it with great caution.
Why do I enter shares and amounts in millions?
It keeps numbers readable. Most filings report in millions. If yours reports in thousands, divide by 1,000 first.
It asks for my email again on another device.
The site remembers you per browser. Enter the same email once on the new device and it unlocks instantly.
Ready to value a stock?
Get the free DCF model
Enter your email and the download unlocks right here, instantly. No password, no credit card. You will also get new LTLM posts and tools. Unsubscribe anytime.
100% freeTakes 5 secondsExcel and Google Sheets
Your DCF model is ready
You are in. Welcome to Learn to Love Money.
Download the spreadsheet, then follow the steps below. Setting it up for a stock takes about 20 minutes.
Download the modelLTLM-DCF-Valuation-Model.xlsx · 33 KB · Free
Using Google Sheets? Here is how →For educational purposes only. This model does not provide personalized financial, investment, tax or legal advice and is not a recommendation to buy, sell or hold any security. Output depends entirely on the assumptions you enter and is not a prediction of future prices. All investing involves risk, including the loss of money.