Hey everyone,
Welcome to the first LTLM Case Study. The idea is simple: take a question investors love to ask, run it against real market history, and show every number. This one is a classic. What if you just bought last year's best-performing S&P 500 stock, every single year? No stock-picking skill, no research. Just buy the winner, hold it for a year, then sell and move into the next winner. I ran it from the end of 2000 through October 2026, and the result is both spectacular and a little bit of a trap. Let's get into it.
1. The experiment
Here are the rules I used:
- The starting point. $10,000 invested on the last trading day of 2000.
- The pick. On the last trading day of each year, find the stock with the highest price return that calendar year and put everything into it. That's 2000's winner for 2001, 2001's winner for 2002, and so on.
- The rotation. Hold for exactly one calendar year, sell, and roll all of it into the new winner. 26 years of this, with 2026 counted year to date through October 12.
- The universe. Companies in the S&P 500 today, ranked by calendar-year price return. A stock also has to have traded for the entire year it won, so I skipped stocks that listed mid-year, such as Leidos in 2006 and SanDisk in 2025. I also skipped the 2018 listing for TKO, whose history only exists under that ticker since 2023, and used the next stock, DexCom.
- The scorecard. Price returns only: no dividends, trading costs or taxes. I compare it to the S&P 500's price return (using the SPY fund as the proxy).
2. The result
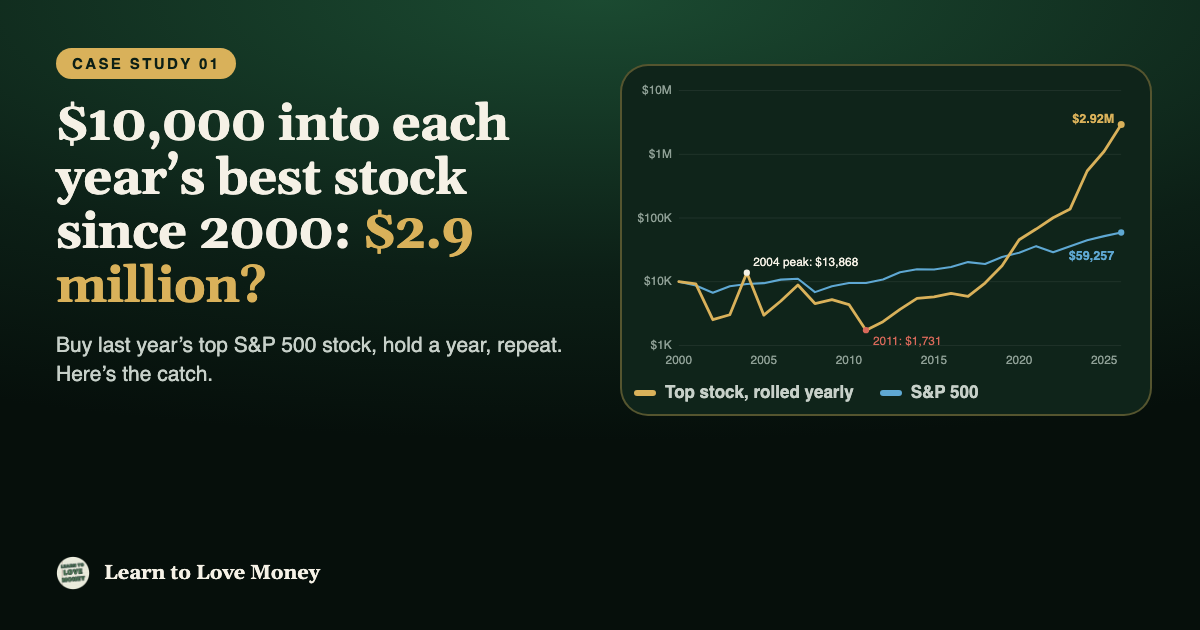
On paper, it's astonishing. The winner-rotation strategy turned $10,000 into about $2.92M, a compound return of roughly 24.4% a year. The S&P 500, over the same stretch, turned it into about $59,257, or roughly 7.1% a year, before dividends.
Rotate into the top stock
$2.92M
Per year, compounded
+24.4%
S&P 500 (price only)
$59,257
Years it beat the index
18 of 26
Growth of $10,000, 2000 to 2026 (log scale)
The chart uses a log scale, where each gridline is ten times the one below it, because otherwise the first twenty years would be a flat line next to the last five. And that flat line is exactly where the story gets interesting.
3. Year by year
Here is every pick. The third column is the huge gain that made it the winner. The fourth is what it did once we owned it. Notice how rarely the two look alike.
| Year held | Stock bought | Its gain the year before | Its gain while held | Your $10,000 becomes | S&P 500 |
|---|---|---|---|---|---|
| 2001 | LHLaboratory Corp. of America | +377% | −7.6% | $9,240 | $8,710 |
| 2002 | BKNGBooking Holdings (then Priceline) | +324% | −72.6% | $2,532 | $6,724 |
| 2003 | ELVElevance Health (then Anthem) | +153% | +19.6% | $3,028 | $8,479 |
| 2004 | AXONAxon (then TASER) | +1,934% | +358.0% | $13,868 | $9,208 |
| 2005 | AXONAxon (then TASER) | +358% | −78.5% | $2,982 | $9,485 |
| 2006 | MNSTMonster Beverage (then Hansen Natural) | +322% | +67.3% | $4,988 | $10,784 |
| 2007 | ICEIntercontinental Exchange | +196% | +77.6% | $8,859 | $11,129 |
| 2008 | FSLRFirst Solar | +786% | −48.8% | $4,536 | $6,867 |
| 2009 | DLTRDollar Tree | +61% | +15.3% | $5,230 | $8,480 |
| 2010 | AMDAdvanced Micro Devices | +342% | −16.4% | $4,372 | $9,566 |
| 2011 | NFLXNetflix | +216% | −60.4% | $1,731 | $9,547 |
| 2012 | DPZDomino's Pizza | +111% | +36.1% | $2,356 | $10,835 |
| 2013 | REGNRegeneron | +203% | +56.0% | $3,676 | $14,054 |
| 2014 | TSLATesla | +330% | +48.5% | $5,459 | $15,642 |
| 2015 | SWKSSkyworks Solutions | +159% | +5.4% | $5,754 | $15,516 |
| 2016 | NFLXNetflix | +133% | +13.6% | $6,536 | $17,006 |
| 2017 | AMDAdvanced Micro Devices | +309% | −10.0% | $5,883 | $20,305 |
| 2018 | XYZBlock (then Square) | +151% | +61.6% | $9,506 | $19,026 |
| 2019 | DXCMDexCom | +108% | +86.9% | $17,767 | $24,505 |
| 2020 | CVNACarvana | +191% | +157.0% | $45,662 | $28,475 |
| 2021 | TSLATesla | +731% | +46.9% | $67,077 | $36,164 |
| 2022 | DVNDevon Energy | +192% | +50.6% | $101,018 | $29,112 |
| 2023 | CEGConstellation Energy | +129% | +37.6% | $139,001 | $36,186 |
| 2024 | CVNACarvana | +1,001% | +294.0% | $547,663 | $44,617 |
| 2025 | APPAppLovin | +722% | +103.5% | $1.11M | $51,934 |
| 2026* | LITELumentum | +338% | +162.4% | $2.92M | $59,257 |
* 2026 is year to date through October 12. Stock returns are price returns from StatMuse; S&P 500 returns from ChartRow (SPY price). Dollar values assume the full balance is moved each year. Not every year's winner is a household name today: companies were renamed, merged or reorganized, so I show the name they traded under then where it differs.
4. What the numbers actually say
- The winning year was never the repeat. The average winner gained about 380% in the year it topped the list. The median gain in the year we owned it was about 42%. Last year's rocket is usually this year's coin flip.
- The first 17 years lost money. After 2017, our $10,000 was worth $5,883, down about 41%, while the S&P 500 had turned it into $20,305. Nearly all the profit came from 2018 on.
- It took a brutal ride. Seven of the 26 years were losers: LH in 2001, Priceline in 2002, TASER in 2005, First Solar in 2008, AMD in 2010 and 2017, and Netflix in 2011. Three of them lost more than 60%. From the end-2004 peak of $13,868, the account fell to $1,731 by 2011, a drop of about 87.5%. It didn't set a new high until 2019.
- The last three years did the heavy lifting. About 96% of the total gain came in 2024, 2025 and 2026, when Carvana, AppLovin and Lumentum went up 294%, 104% and 162%. Take away those three and this is a very average story.
- Repeat winners happen. Axon (when it was TASER), Netflix, AMD, Tesla and Carvana each made the list twice. That's momentum showing up, and it helped, but it also didn't prevent TASER's 78% loss in 2005.
5. Why you couldn't actually run this
The headline number is real arithmetic on real prices, but it is not a strategy anyone could have followed. Four big reasons:
- Survivorship and hindsight. I ranked stocks that are in the S&P 500 today. In 2003, TASER was a tiny company nowhere near the index, and Carvana in 2019 was a recent IPO still losing money. The list quietly contains companies that were later rewarded for winning, which makes the past look more repeatable than it was.
- Taxes and costs. Selling every year in a taxable account turns each gain into a tax bill, and short-term gains are taxed at ordinary income rates. A 24% pre-tax return could look quite different after tax, and the larger the account, the more trading in thinly traded names costs.
- Size and liquidity. Moving into a small-cap rocket works with $10,000. At $2 million it's a different problem.
- Human nature. Stomaching an 87.5% drawdown, then handing everything to whatever just went up the most, is something almost no investor sticks with. Most would have quit after 2002 or after 2011, right before the best years.
6. What I'd take from it
- Last year's winner is a headline, not a plan. Big one-year gains tell you a stock got hot, not that it will keep going.
- Concentration cuts both ways. One stock at a time gave the best and worst outcomes here. The index never had a year worse than about −38%.
- Time and sequence matter. The same returns in a different order could have meant a very different result, and 17 years of waiting is a long time to be underwater.
- The boring option held up better than it looks. A plain S&P 500 fund grew $10,000 into about $59,257 with none of this drama. If you want more of the basics, start with the Investing Basics course and the handbook guide on S&P 500 holding periods.
The bottom line: this is a fun experiment about the power of compounding and the danger of hindsight. What you do with your own money is a question only you can answer.
NOT FINANCIAL ADVICE. This post is an educational case study of historical data and is not a recommendation to buy, sell, or hold any security. Past performance does not predict future results. Returns are price-only and hypothetical, assume no taxes, fees or slippage, and draw on stocks that are S&P 500 members today. Figures come from third-party data providers, are rounded, and may differ slightly from other sources; check before relying on them. This post was prepared with AI assistance; see our AI Disclosure.
Sources
- Annual top S&P 500 stocks by return (StatMuse): 2000, 2001, 2002, 2003, 2004, 2005, 2006, 2007, 2008, 2009, 2010, 2011, 2012, 2013, 2014, 2015, 2016, 2017, 2018, 2019, 2020, 2021, 2022, 2023, 2024, 2025
- Each stock's return in the year held (StatMuse): LH 2001, BKNG 2002, ELV 2003, AXON 2004, AXON 2005, MNST 2006, ICE 2007, FSLR 2008, DLTR 2009, AMD 2010, NFLX 2011, DPZ 2012, REGN 2013, TSLA 2014, SWKS 2015, NFLX 2016, AMD 2017, XYZ 2018, DXCM 2019, CVNA 2020, TSLA 2021, DVN 2022, CEG 2023, CVNA 2024, APP 2025, LITE 2026
- S&P 500 annual price returns (SPY proxy): ChartRow