The short answer
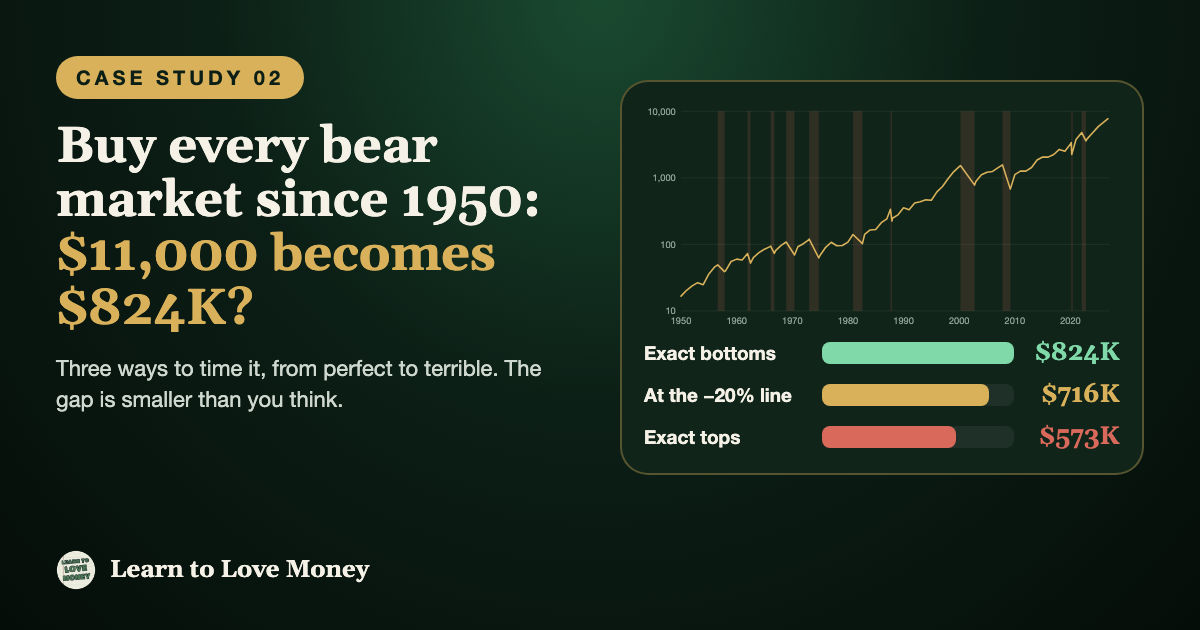
Putting $1,000 into the S&P 500 in each of the 11 bear markets since 1950 turned $11,000 into about $716,000 when bought at the −20% line, about $824,000 when bought at the exact bottom, and about $573,000 when bought at the exact top, valued at the October 2, 2026 close (price only).
Perfect timing beat the simple −20% rule by only 15%, and even buying every single peak was profitable. The difference between the oldest and newest buy was about 97 times, versus 1.4 times between the best and worst timing: when you invest mattered far more than whether you nailed the day.
Hey everyone,
Welcome to Case Study 02. The question this time is one almost every investor asks at some point: what if I just waited for the stock market to crash and bought the dip? Waiting for a crash feels smart. So I tested it three ways, from the most realistic to the least. I put $1,000 into the S&P 500 during each of the 11 bear markets since 1950, once buying the moment the market fell 20% from its high, once buying the exact bottom, and once buying the exact top right before the fall. The results will probably surprise you, and the gap between the best and the worst version is a lot smaller than you'd guess.
What is the experiment, and which 11 bear markets does it cover?
First, a quick definition. A bear market is when the S&P 500 closes at least 20% below its previous high. Since 1950 there have been 11 of them, going by closing prices. Here are the rules I used:
- The buys. $1,000 into the S&P 500 for each bear market. That's 11 buys and $11,000 in total.
- Three scenarios. Buy at the −20% line (the day the market first closes 20% below its peak, which is when the media starts using the words "bear market"), buy at the exact bottom (the lowest close of the drop), or buy at the exact top (the highest close before the drop).
- The finish line. Hold every buy until the S&P 500 close on October 2, 2026, at 7,722.72.
- The scorecard. Price returns only: no dividends, taxes or fees. Dividends would make every number here bigger.
Here are the 11 bear markets, with the index level at each peak and trough:
| # | Bear market | Peak | Trough | Decline | Your −20% buy |
|---|---|---|---|---|---|
| 1 | 1956-57 | Aug 1956 · 49 | Oct 1957 · 39 | −21% | 39 |
| 2 | 1961-62 | Dec 1961 · 73 | Jun 1962 · 52 | −28% | 58 |
| 3 | 1966 | Feb 1966 · 94 | Oct 1966 · 73 | −22% | 75 |
| 4 | 1968-70 | Nov 1968 · 108 | May 1970 · 69 | −36% | 87 |
| 5 | 1973-74 | Jan 1973 · 120 | Oct 1974 · 62 | −48% | 96 |
| 6 | 1980-82 | Nov 1980 · 141 | Aug 1982 · 102 | −27% | 112 |
| 7 | 1987 | Aug 1987 · 337 | Dec 1987 · 224 | −34% | 269 |
| 8 | 2000-02 | Mar 2000 · 1,527 | Oct 2002 · 777 | −49% | 1,222 |
| 9 | 2007-09 | Oct 2007 · 1,565 | Mar 2009 · 677 | −57% | 1,252 |
| 10 | 2020 | Feb 2020 · 3,386 | Mar 2020 · 2,237 | −34% | 2,709 |
| 11 | 2022 | Jan 2022 · 4,797 | Oct 2022 · 3,577 | −25% | 3,837 |
Index levels are closing prices, rounded. The −20% level is 0.8 times the prior closing peak. Bear market peaks and troughs follow Yardeni Research's list.
On average these drops were about 35% from peak to trough. The shallowest barely cleared the line (1956 to 1957, −21%) and the deepest was the 2008 financial crisis (−57%). Here's what they look like on the long-term chart, with each bear market shaded:
S&P 500, 1950 to 2026 (log scale)
The chart uses a log scale, where each gridline is ten times the one before it, so a move from 100 to 1,000 looks the same as a move from 1,000 to 10,000. It's the only way to fit 76 years on one screen. Each shaded band looks like a disaster up close and a hiccup from far away. Keep that picture in mind as you read the results.
Scenario 1: What if you buy at the −20% line?
This is the most realistic of the three. You can't know a bottom while you're in it, but you can know the day the market closes 20% below its high. It's a clear, mechanical rule: "When the S&P 500 is down 20%, I invest $1,000."
Where the −20% buys land
The result: $11,000 became about $716K, or 65 times the money. Here is what each $1,000 is worth today:
Total put in
$11,000
Worth today
$716K
Avg drop after buying
−18%
Worst drop after buying
−46%
What each $1,000 is worth today: bought at the −20% line
Two things jump out. First, the early buys do almost all of the work. Buy #1, made around 1957, grew to $196K by itself, which is 27% of the total. The three oldest buys account for 60%. The last four buys (2000, 2007, 2020 and 2022) put in $4,000 and are worth about $17K today.
Second, buying at the −20% line is not buying the bottom. In every bear market the index kept falling after you bought. The average further drop was about 18%, and in three of them (1973-74, 2000-02 and 2007-09) it fell 35% or more. Here is how far each one went on from the buy:
| # | Bear market | Bought at (−20%) | Fell further to | Further drop |
|---|---|---|---|---|
| 1 | 1956-57 | 39 | 39 | −1% |
| 2 | 1961-62 | 58 | 52 | −10% |
| 3 | 1966 | 75 | 73 | −3% |
| 4 | 1968-70 | 87 | 69 | −20% |
| 5 | 1973-74 | 96 | 62 | −35% |
| 6 | 1980-82 | 112 | 102 | −9% |
| 7 | 1987 | 269 | 224 | −17% |
| 8 | 2000-02 | 1,222 | 777 | −36% |
| 9 | 2007-09 | 1,252 | 677 | −46% |
| 10 | 2020 | 2,709 | 2,237 | −17% |
| 11 | 2022 | 3,837 | 3,577 | −7% |
Imagine buying in late 2007 at 1,252, watching it fall to 677, and having to keep believing in the plan. That's 46% down on a buy that was supposed to be "the smart dip." It still finished at $6.2K, but you had to sit through it.
Scenario 2: What if you buy the exact bottom?
Now the fantasy version. You have a time machine and you put each $1,000 in on the single lowest closing day of each bear market. Nobody can do this, but it tells us the ceiling.
Where the perfect buys land
The result: $11,000 became about $824K, or 75 times the money. That's just 15% more than the simple −20% rule.
Total put in
$11,000
Worth today
$824K
vs. buying at −20%
+15%
Worst buy (2022)
$2.2K
What each $1,000 is worth today: bought at the exact bottom
Look at that for a moment. Perfect timing, 11 times in a row, only beat the "just buy when it's down 20%" rule by about one-seventh. The reason is that the −20% line already catches a big part of the recovery. By the time the market has fallen 20%, you're usually only partway down, and the full climb back up the other side still lands in your pocket.
Scenario 3: What if you buy the exact top?
Now the nightmare. Every $1,000 goes in on the highest close right before a bear market began. Imagine the worst luck imaginable, 11 times: you buy, and then the market promptly drops 20% to 57%.
Where the worst-timed buys land
The result: $11,000 became about $573K, or 52 times the money. That's 30% less than perfect timing, and every single buy is still in the green today.
Total put in
$11,000
Worth today
$573K
vs. buying bottoms
−30%
Worst buy (2022)
$1.6K
What each $1,000 is worth today: bought at the exact top
Even the worst-timed buy of all, the January 2022 peak, is worth $1.6K today, or about 61% more than what was put in. It took until 2024 to get back to even, but it got there.
The three scenarios compared, buy by buy
$11,000 invested, worth today
Here is every buy in all three scenarios. The last column shows the average yearly return of each −20% buy, from its buy date to today:
| # | Bear market | At the −20% line | At the exact bottom | At the exact top | −20% buy, per year |
|---|---|---|---|---|---|
| 1 | 1956-57 | $196K | $198K | $157K | 8.0% |
| 2 | 1961-62 | $133K | $148K | $106K | 7.9% |
| 3 | 1966 | $103K | $106K | $82K | 8.0% |
| 4 | 1968-70 | $89K | $111K | $71K | 8.2% |
| 5 | 1973-74 | $80K | $124K | $64K | 8.6% |
| 6 | 1980-82 | $69K | $75K | $55K | 9.9% |
| 7 | 1987 | $29K | $34K | $23K | 9.0% |
| 8 | 2000-02 | $6.3K | $9.9K | $5.1K | 7.4% |
| 9 | 2007-09 | $6.2K | $11K | $4.9K | 10.3% |
| 10 | 2020 | $2.9K | $3.5K | $2.3K | 17.3% |
| 11 | 2022 | $2.0K | $2.2K | $1.6K | 18.3% |
| All 11 buys | $716K | $824K | $573K |
Per-year return is the compound annual price return of each −20% buy, from its estimated buy date to October 2, 2026.
And here is where the money in the −20% scenario actually came from:
Share of the final total, by buy (−20% line)
What do the numbers actually say?
- Time beat timing. The difference between the best and worst timing was 1.4x. The difference between the oldest and newest buy was about 97x. When you invest matters far more than whether you nailed the exact day.
- Even the worst buys worked. Buying the exact peak before every crash since 1950 still turned $11,000 into about $573K. The market's habit of recovering did most of the work, not the entry price.
- Later buys earned a higher yearly return and far fewer dollars. The 2020 and 2022 buys have compounded at 17% to 18% a year, versus 8% to 10% for the early ones. But they've had only a few years, while the first buys had 69 years.
- A single lump sum rivals the whole plan. $1,000 invested in January 1950 and never touched would be about $464K today on price alone. That single buy, with no forecasting at all, is worth about 81% of what the worst-timed 11-buy plan produced, from one-eleventh of the money.
- Waiting has a price. The gaps between bear markets were long: 13 years between 1987 and 2000, and 11 years between 2009 and 2020. Any cash set aside to "buy the dip" sat on the sidelines during some of the best years in market history.
What are the limits of this backtest?
- Hindsight. You only know a peak or a bottom after it's behind you. The bottom scenario is a ceiling that no real investor can touch, and so is the top scenario as a floor.
- The −20% line is easy to see, and hard to follow. The market is already down 20% and the headlines are terrifying. The average buy kept falling another 18%, and in 2007 it fell 46%. A rule is only worth something if you follow it when it hurts.
- Only one market. This is the U.S. S&P 500, one of the best-performing markets of the last century. Other countries had bear markets that never fully recovered. Today's market, near all-time highs, is also not a fair test of tomorrow.
- Price only, with simplifications. I left out dividends, taxes, fees and any interest the cash earned while waiting. The bear markets were identified using closing prices, and the −20% buy dates are estimates.
Key takeaways
- You don't need a perfect entry. Even buying every single top worked out over a long enough time. A good plan you follow beats a perfect plan you wait for.
- Falling markets are where long-run returns are made. Every large gain here started in a scary headline. Having cash and a plan to use it helps, as long as you've decided ahead of time what the plan is.
- Time in the market is the biggest lever. The earliest buys carried the whole study. If you want more on this, start with the S&P 500 holding periods guide and the Investing Basics course.
The bottom line: bear markets are painful, frequent and, so far, temporary. This study shows what the past looked like, and nothing about it guarantees the next 76 years. What you do with your own money is a question only you can answer.
Frequently asked questions
What if you bought every bear market since 1950?
With $1,000 into each of the 11 bear markets, buying at the −20% line turned $11,000 into about $716,000, buying the exact bottom into about $824,000, and buying the exact top into about $573,000, valued at the S&P 500's October 2, 2026 close of 7,722.72.
What counts as a bear market?
The S&P 500 closing at least 20% below its previous high. Going by closing prices, there have been 11 since 1950, with an average peak-to-trough decline of about 35%, from −21% in 1956-57 to −57% in 2007-09.
Is buying at the 20% decline a good strategy?
It worked well here, but it is not buying the bottom. In every bear market the index kept falling after the −20% buy, by an average of about 18% and by 46% in 2007-09. The rule only helps if you follow it when it hurts.
How much better is perfect market timing than just buying the dip?
Not much. Buying every exact bottom beat the −20% rule by just 15%, because the −20% line already catches a big part of the recovery.
What are the limits of this backtest?
It uses hindsight to find peaks and bottoms, covers only the U.S. market (one of the best-performing of the last century), is price-only with no dividends, taxes, or fees, and uses estimated −20% buy dates.
NOT FINANCIAL ADVICE. This post is an educational case study of historical data and is not a recommendation to buy, sell, or hold any security. Past performance does not predict future results. Returns are price-only and hypothetical, assume no taxes, fees or slippage, and assume the buys were made at levels that could only be identified in hindsight. Index levels are rounded closing prices; the charts show a simplified line made of year-end closes plus each bear market's peak and trough, and the −20% buy dates are estimated. Figures come from third-party data, may differ slightly from other sources, and should be checked before relying on them. This post was prepared with AI assistance; see our AI Disclosure.
Sources
- S&P 500 bull and bear market peaks and troughs (Yardeni Research): Stock Market Indicators: Bull & Bear Markets, S&P 500 corrections and bear markets (tables)
- S&P 500 closing price on October 2, 2026 (7,722.72), used as the value today for every buy.